
Meta says 4.2×, Google says 3.1×. Both are right.
Two platforms, two ROAS figures, one budget decision. The numbers aren't measuring the same thing — and moving money between them as if they were is the most common expensive mistake in multi-channel accounts.
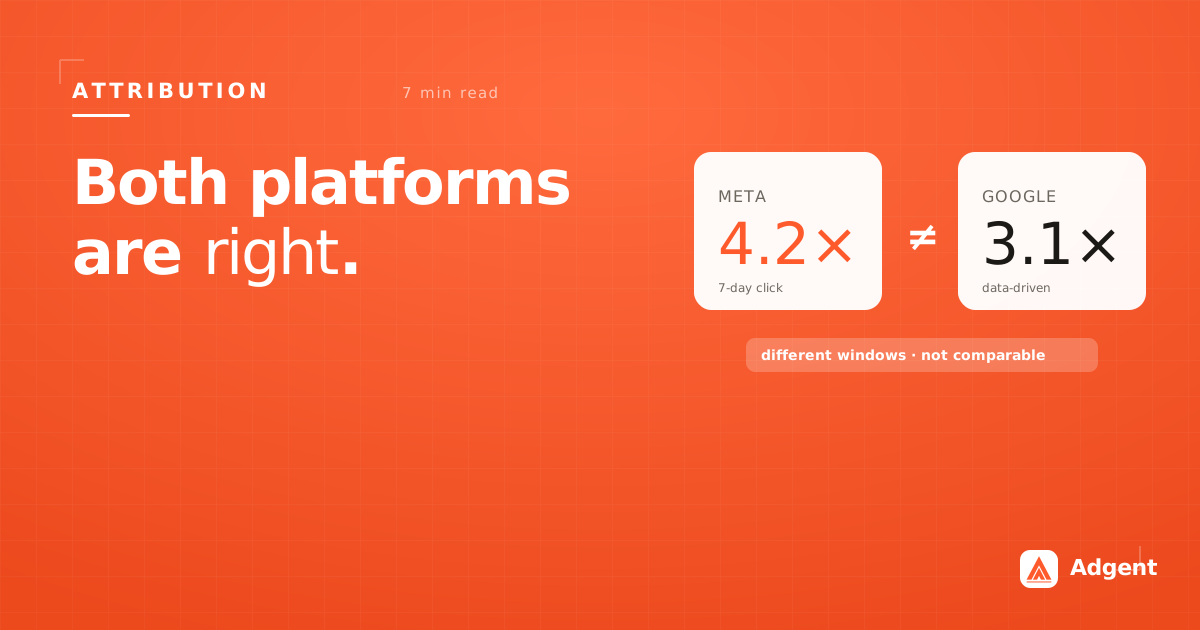
No — not directly. Meta and Google measure ROAS with different attribution windows, credit models and conversion definitions, so 4.2× and 3.1× aren't the same unit. To compare them, normalize the windows, anchor both to your GA4 or store revenue, and read direction over level.
You're running both. Meta reports 4.2×, Google reports 3.1×, and the conclusion writes itself: move budget to Meta. It's the most natural decision in the account, and you have almost no evidence for it.
Three ways the numbers disagree
Meta and Google aren't reporting the same metric under the same name. They're reporting three different disagreements at once.
- Different windows. Meta defaults to 7-day click, 1-day view. Google Ads runs its own windows, commonly 30-day click. A longer window catches more conversions — mechanically, not because the channel worked harder.
- Different models. Google's data-driven attribution spreads credit across the path. Meta credits the platform's own touchpoints on a last-touch basis. One is sharing credit; the other is claiming it.
- Different definitions. A "purchase" fired by Meta's pixel and a "conversion" counted by a Google tag can be counting different events, deduplicated differently, at different points in the funnel.
Both platforms are honest. Neither is comparable. The dishonesty is in the subtraction you do between them.
The double-counting problem
Here's the tell that something's broken. Add up platform-reported revenue across your channels and compare it to what your Shopify or GA4 says you actually made. In most multi-channel accounts, the platforms claim more revenue than the business earned.
That's not fraud, it's arithmetic. A customer who saw a Meta ad on Monday and clicked a Google search ad on Wednesday is one purchase — and both platforms will report it, because from where each one sits, it's true. Sum them and you've counted the same money twice.
Building a comparability boundary
You can't make the platforms agree; they're structurally incapable of it, and each has an interest in claiming the conversion. What you can do is decide, deliberately, what you're willing to compare. That's a comparability boundary, and it's built the same way every time:
- Anchor on ground truth. Your store or your GA4 knows what you actually sold. That's the denominator every platform claim gets checked against — not the other way round.
- Normalize the windows. Pull both platforms on the same lookback before you compare. It won't be perfect, but it removes the most mechanical distortion.
- Compare direction, not level. Meta at 4.2× and Google at 3.1× tells you little. Meta trending up 15% while Google is flat, at matched windows against real revenue, tells you where the next euro goes.
- Watch the blended number. Total spend against ground-truth revenue is the only figure that can't be double-counted. If your channels look great and blended is flat, the channels are eating each other.
Why the platforms will never fix this
It's worth being clear about the structural reason. Each platform measures its own contribution with its own ruler and reports it in good faith — and neither has any incentive to normalize its ruler against a rival's. Google can now read Meta spend: it ingests Meta and TikTok ad cost into GA4 natively, and it will even model the cross-channel split for you. But it grades that model with its own attribution, and its own documentation draws the line — "these tools are for planning purposes only and won't affect budgets or spend in your connected accounts."
So the cross-platform allocation call — the one that decides where your marginal euro actually goes — is one the platforms will model but not make. They plan; they don't execute. That's the seat Adgent takes: it reads both platforms through their own APIs, reconciles the claims against your ground-truth revenue, holds the comparability boundary so the comparison survives scrutiny — and then moves the money.
Two platforms reporting different numbers isn't a bug to be resolved. It's the permanent condition of running more than one channel — and the work is building a view that's honest about it.
Windows aren't a detail — they're most of the gap
If you only fix one thing, fix the window. It's the single largest mechanical source of the disagreement, and it has nothing to do with which channel is actually working. Meta's default 7-day click / 1-day view means a purchase only counts if it lands within a week of a click, or a day of a view. Google Ads commonly runs a 30-day click window on the same account. Give any channel four times as long to catch a conversion and it will catch more of them — the same buyers, credited later, on a longer clock.
This is why normalizing the lookback before you compare does more work than any other single move. Pull both platforms on a matched window — 7-day click on each, say — and a chunk of the 4.2× vs 3.1× gap simply evaporates, because you've stopped comparing a sprint to a marathon. It won't make the numbers identical; the models and definitions still differ. But it removes the distortion you can actually remove, and what's left is a more honest starting point. We go deeper on this in why the 7-day window is lying before noon — the same clock problem, one channel at a time.
The view-through trap: not all credit is earned
There's a subtler distortion hiding inside the window difference, and it flatters whichever platform leans on view-through credit. A view-through conversion counts a purchase because someone saw an ad — no click, no deliberate action. On Meta, that's the 1-day view leg of the default window; on placements like Audience Network it can quietly inflate reported ROAS with impressions that scrolled past unnoticed. When you compare a channel earning mostly click credit against one padded with view credit, you're not comparing performance — you're comparing how generously each platform counts a glance as an outcome.
The practical guard is to look at how the credit was earned, not just how much of it there is. A channel showing high ROAS on mostly view-through conversions is making a weaker claim than a channel showing the same number on clicks, even at a matched window. This is the kind of distinction a raw platform export hides and a real analyst surfaces — the same instinct behind an AI media buyer that reads the account like a strategist rather than rendering the dashboard's headline figure and calling it truth.
What this means for how you allocate
Put it together and the allocation rule changes shape. You stop asking "which platform has the higher ROAS?" — an unanswerable question across incompatible units — and start asking "at a matched window, checked against real revenue, which channel is trending up and which is flat?" Level is noise between platforms; direction survives the comparability boundary because it's measured inside each channel's own consistent ruler over time.
Then you let the blended number keep everyone honest. Total spend against ground-truth revenue is the one figure that can't be double-counted, because there's only one denominator — what the business actually earned. When your channels each look strong but blended ROAS is flat, that's the signature of channels claiming the same conversions and eating each other. The comparability boundary isn't a report you build once; it's a discipline you hold every time a platform hands you a confident number and invites you to move budget on it.
Holding the comparability boundary means redoing the same reconciliation every time a platform hands you a confident number. Adgent reads Meta and Google as one account, matches the windows, checks both against ground-truth revenue, and shows where the two are claiming the same conversion. If you want to see your channels compared on a ruler that survives the boundary, request a demo — one real finding on your own account, before you change anything.
Frequently asked
Can I compare Meta and Google ROAS directly?
Why are Meta and Google ROAS different?
How do attribution windows differ between platforms?
What is the double-counting problem?
How do I build a comparability boundary?
Which platform reports higher ROAS?
Adgent reads Meta and Google accounts overnight and hands you one brief each morning — the diagnosis, the evidence from your own account, and a change you approve before anything writes. Read-only by default. It analyzes creative; it doesn't make it.